- Home
- Tutorial
- Resource Guides
- Focus Areas
- LSF Programs
-
Professional
Development - Review Process
-
A project of LSF

Search for Resources
Description
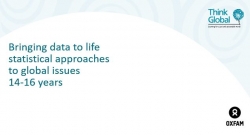
This well planned resource includes 3 sessions that have students represent real life data in different means. It includes ready to use presentations and handouts, background information and lesson plans. Students will be using
Session 1: Learners are introduced to Ethiopia and learn to plot the relevant associated data as a scatter graph.
Session 2: Learners will use cumulative frequency graphs to compare the wealth index of WCA and non-WCA members in Ethiopia and Mali.
Session 3: Learners use pie charts to compare the marital status of WCA and non-WCA members in Ethiopia and Mali. They will also look at histograms considering the years of experience of women in Ethiopia. This session also includes a summary of learning from the three sessions.
General Assessment
What skills does this resource explicitly teach?
Plotting a scatter graph and line of best fit
Distinguishing correlation from causation in examining two sets of data
Creating a cumulative frequency graph
Drawing a histogram using frequency density
Interpret,analyze and compare graphs, tables, diagrams and charts
Strengths
Extremely well-planned lessons with presentations and handouts ready for use. The background information is extensive and helpful
Key Questions to ask students are provided
Not only do students represent data using different methods, they also get to see the limitations and benefits of each approach.
-
Weaknesses
There are no actual evaluation tools included in this resource.
No hands-on activities for students and all learning takes place in a classroom setting.
Mostly teacher-led activities.
Recommendation of how and where to use it
This resource would be great in any course that has students working with data management. It is always great to be able to provide students with authentic data to graph. High School mathematics classes in data management units would find this resource useful.
This resource supports Humanities as well as Math outcomes and promotes cross-curricular learning.
Relevant Curriculum Units
The following tool will allow you to explore the relevant curriculum matches for this resource. To start, select a province listed below.
- Step 1Select a province
- Alberta
- Step 2Select a grade level
- Grade 7
- Step 3Select a subject
- Math
- Step 4Relevant matches
- Statistics and Probality
- Grade 8
- Step 3Select a subject
- Math
- Step 4Relevant matches
- Statistics and probability
- Grade 9
- Step 3Select a subject
- Math
- Step 4Relevant matches
- Knowlege And Employability: Statistics and Probability
- Statistics and Probability
- Grade 11
- Step 3Select a subject
- Math
- Step 4Relevant matches
- Math 20-2: Statistics
- Grade 12
- Step 3Select a subject
- Math
- Step 4Relevant matches
- Mathematics 30-3:Statistics
- British Columbia
- Step 2Select a grade level
- Grade 7
- Step 3Select a subject
- Math
- Step 4Relevant matches
- Data from circle graphs can be used to illustrate proportion and to compare and interpret.
- Linear relations can be represented in many connected ways to identify regularities and make generalizations
- Grade 8
- Step 3Select a subject
- Math
- Step 4Relevant matches
- Analyzing data by determining averages is one way to make sense of large data sets and enables us to compare and interpret
- Discrete linear relationships can be represented in many connected ways and used to identify and make generalizations
- Number represents, describes, and compares the quantities of ratios, rates, and percents
- Grade 9
- Step 3Select a subject
- Math
- Step 4Relevant matches
- Continuous linear relationships can be identified and represented in many connected ways to identify regularities and make generalizations
- Grade 10
- Step 3Select a subject
- Math
- Step 4Relevant matches
- Foundations of Mathematics and Pre-calculus: Representing and analyzing situations allows us to notice and wonder about relations.
- Workplace Mathematics: Representing and analyzing data allows us to notice and wonder about relationships
- Grade 11
- Step 3Select a subject
- Math
- Step 4Relevant matches
- Foundations of Mathematics 11: Statistical analysis allows us to notice, wonder about, and answer questions about variation
- Workplace Mathematics 11: Representing and analyzing data allows us to notice and wonder about relationships
- Manitoba
- Step 2Select a grade level
- Grade 7
- Step 3Select a subject
- Math
- Step 4Relevant matches
- Statistics and Probability
- Grade 8
- Step 3Select a subject
- Math
- Step 4Relevant matches
- Statistics and Probability
- Grade 9
- Step 3Select a subject
- Math
- Step 4Relevant matches
- Patterns & Relations
- Grade 11
- Step 3Select a subject
- Math
- Step 4Relevant matches
- Essential Mathematics : Statistics
- Grade 12
- Step 3Select a subject
- Math
- Step 4Relevant matches
- Math Essential: Statistics & Probability
- New Brunswick
- Step 2Select a grade level
- Grade 7
- Step 3Select a subject
- Math
- Step 4Relevant matches
- Statistics and Probability
- Social Studies
- Step 4Relevant matches
- Cultures
- Empowerment: Civics
- Atlantic Canada and the World:
- Grade 8
- Step 3Select a subject
- Math
- Step 4Relevant matches
- Statistics and Probability
- Grade 9
- Step 3Select a subject
- Math
- Step 4Relevant matches
- Patterns and Relations
- Statistics and Probability
- Grade 11
- Step 3Select a subject
- Math
- Step 4Relevant matches
- Financial and Workplace Mathematics 110: Statistics
- Newfoundland & Labrador
- Step 2Select a grade level
- Grade 7
- Step 3Select a subject
- Math
- Step 4Relevant matches
- Statistics & Probability
- Social Studies
- Step 4Relevant matches
- Societal Empowerment
- Grade 8
- Step 3Select a subject
- Math
- Step 4Relevant matches
- Statistics & Probability
- Grade 9
- Step 3Select a subject
- Math
- Step 4Relevant matches
- Patterns and Relations
- Grade 12
- Step 3Select a subject
- Math
- Step 4Relevant matches
- Math 3202: Statistics
- Northwest Territories
- Step 2Select a grade level
- Grade 7
- Step 3Select a subject
- Math
- Step 4Relevant matches
- Data from circle graphs can be used to illustrate proportion and to compare and interpret.
- Linear relations can be represented in many connected ways to identify regularities and make generalizations
- Grade 8
- Step 3Select a subject
- Math
- Step 4Relevant matches
- Analyzing data by determining averages is one way to make sense of large data sets and enables us to compare and interpret
- Discrete linear relationships can be represented in many connected ways and used to identify and make generalizations
- Number represents, describes, and compares the quantities of ratios, rates, and percents
- Grade 9
- Step 3Select a subject
- Math
- Step 4Relevant matches
- Continuous linear relationships can be identified and represented in many connected ways to identify regularities and make generalizations
- Grade 10
- Step 3Select a subject
- Math
- Step 4Relevant matches
- Foundations of Mathematics and Pre-calculus: Representing and analyzing situations allows us to notice and wonder about relations.
- Workplace Mathematics: Representing and analyzing data allows us to notice and wonder about relationships
- Grade 11
- Step 3Select a subject
- Math
- Step 4Relevant matches
- Foundations of Mathematics 11: Statistical analysis allows us to notice, wonder about, and answer questions about variation
- Workplace Mathematics 11: Representing and analyzing data allows us to notice and wonder about relationships
- Grade 12
- Step 3Select a subject
- Math
- Step 4Relevant matches
- Mathematics 30-3:Statistics
- Nova Scotia
- Step 2Select a grade level
- Grade 7
- Step 3Select a subject
- Math
- Step 4Relevant matches
- Statistics & Probability
- Grade 8
- Step 3Select a subject
- Math
- Step 4Relevant matches
- Statistics & Probability
- Grade 9
- Step 3Select a subject
- Grade 11
- Step 3Select a subject
- Math
- Step 4Relevant matches
- Math 11: Statistics
- Nunavut
- Step 2Select a grade level
- Grade 7
- Step 3Select a subject
- Math
- Step 4Relevant matches
- Statistics and Probability
- Grade 8
- Step 3Select a subject
- Math
- Step 4Relevant matches
- Knowledge and Employability: Statistics and Probability
- Statistics & Probability
- Grade 9
- Step 3Select a subject
- Math
- Step 4Relevant matches
- Knowlege And Employability: Statistics and Probability
- Grade 11
- Step 3Select a subject
- Math
- Step 4Relevant matches
- Mathematics (Apprenticeship and Workplace Math):Statistics
- Grade 12
- Step 3Select a subject
- Math
- Step 4Relevant matches
- Mathematics 30-3:Statistics
- Ontario
- Prince Edward Island
- Step 2Select a grade level
- Grade 7
- Step 3Select a subject
- Math
- Step 4Relevant matches
- Statistics & Probability
- Grade 8
- Step 3Select a subject
- Math
- Step 4Relevant matches
- Statistics & Probability
- Grade 9
- Step 3Select a subject
- Math
- Step 4Relevant matches
- Patterns and Relations
- Statistics and Probability
- Grade 10
- Step 3Select a subject
- Math
- Step 4Relevant matches
- Math 421A. Relations and Functions
- Grade 11
- Step 3Select a subject
- Math
- Step 4Relevant matches
- Math 521A: Statistics
- Quebec
- Step 2Select a grade level
- Grade 7
- Step 3Select a subject
- Math
- Step 4Relevant matches
- Statistics and probability
- Grade 8
- Step 3Select a subject
- Math
- Step 4Relevant matches
- Statistics and probability
- Grade 9
- Step 3Select a subject
- Math
- Step 4Relevant matches
- Statistics & Probability
- Grade 10
- Step 3Select a subject
- Math
- Step 4Relevant matches
- Statistics and probability
- Grade 11
- Step 3Select a subject
- Geography
- Step 4Relevant matches
- Cultural Geography: African Cultural Area
- Saskatchewan
- Step 2Select a grade level
- Grade 7
- Step 3Select a subject
- Math
- Step 4Relevant matches
- Mathematics 7: Statistics and Probability
- Grade 8
- Step 3Select a subject
- Math
- Step 4Relevant matches
- Mathematics 8: Statistics and Probability
- Grade 9
- Step 3Select a subject
- Math
- Step 4Relevant matches
- Math 9:Patterns and Relations
- Grade 11
- Step 3Select a subject
- History
- Step 4Relevant matches
- History 20: Global Issues
- Social Studies
- Step 4Relevant matches
- World Issues - Wealth & Poverty
- Social Studies 20
- Yukon Territory
- Step 2Select a grade level
- Grade 7
- Step 3Select a subject
- Math
- Step 4Relevant matches
- Data from circle graphs can be used to illustrate proportion and to compare and interpret.
- Linear relations can be represented in many connected ways to identify regularities and make generalizations
- Grade 8
- Step 3Select a subject
- Math
- Step 4Relevant matches
- Analyzing data by determining averages is one way to make sense of large data sets and enables us to compare and interpret
- Discrete linear relationships can be represented in many connected ways and used to identify and make generalizations
- Number represents, describes, and compares the quantities of ratios, rates, and percents
- Grade 9
- Step 3Select a subject
- Math
- Step 4Relevant matches
- Continuous linear relationships can be identified and represented in many connected ways to identify regularities and make generalizations
- Grade 10
- Step 3Select a subject
- Math
- Step 4Relevant matches
- Foundations of Mathematics and Pre-calculus: Representing and analyzing situations allows us to notice and wonder about relations.
- Workplace Mathematics: Representing and analyzing data allows us to notice and wonder about relationships
- Grade 11
- Step 3Select a subject
- Math
- Step 4Relevant matches
- Foundations of Mathematics 11: Statistical analysis allows us to notice, wonder about, and answer questions about variation
- Workplace Mathematics 11: Representing and analyzing data allows us to notice and wonder about relationships
Themes Addressed
Economics (1)
- Poverty Reduction
Human Rights (3)
- Cultural Diversity
- Gender Equality
- Poverty
Sustainability Education Principles
| Principle | Rating | Explanation |
|---|---|---|
| Consideration of Alternative Perspectives | Good | This resource uses factual information from Ethiopia and Mali. Students represent the data using a variety of tools and consider the advantages and disadvantages of each. |
Consideration of Alternative Perspectives:
| ||
| Multiple Dimensions of Problems & Solutions | Satisfactory | The resource Bringing Data to Life provides opportunities to connect the social, economic and environmental dimensions related to quality of life issues in Ethiopia and Mali. |
| Multiple Dimensions of Problems & Solutions: Effectively addresses the environmental, economic and social dimensions of the issue(s) being explored.
| ||
| Respects Complexity | Satisfactory | |
| Respects Complexity: The complexity of the problems/issues being discussed is respected. | ||
| Acting on Learning | Poor/Not considered | Not Considered |
| Acting on Learning: Learning moves from understanding issues to working towards positive change — in personal lifestyle, in school, in the community, or for the planet
| ||
| Values Education | Good | Opportunities and questions for student reflection are provided. |
| Values Education: Students are explicitly provided with opportunities to identify, clarify and express their own beliefs/values. | ||
| Empathy & Respect for Humans | Very Good | Students will look at and develop a better understanding of the reality for women in other parts of the world, Ethiopia and Mali in this case. Students will see examples of the poverty disparity between sexes and a gain a better understanding of the different culture in Ethiopia and Mali. |
| Empathy & Respect for Humans: Empathy and respect are fostered for diverse groups of humans (including different genders, ethnic groups, sexual preferences, etc.). | ||
| Personal Affinity with Earth | Poor/Not considered | Although students receive information on farming in Ethiopia and Mali, there is no real connection made. |
| Personal Affinity with Earth: Encourages a personal affinity with -the natural world.
| ||
| Locally-Focused Learning | Poor/Not considered | Not Considered: Throughout this resource, students are asked to look at data from another continent. Although it is positive for students to be aware of the struggles in other parts of the world there is no connection made to their local community. |
| Locally-Focused Learning: Includes learning experiences that take advantage of issues/elements within the local community.
| ||
| Past, Present & Future | Good | This resource provides a lot of background information and explains how the Researching Women's Collective Action Project was launched. It explains it's present and future goals. |
| Past, Present & Future: Promotes an understanding of the past, a sense of the present, and a positive vision for the future. | ||
Pedagogical Approaches
| Principle | Rating | Explanation |
|---|---|---|
| Open-Ended Instruction | Satisfactory | Although most of the resource is directed teaching, students get to determine for themselves the limitations and strengths of the different graphing methods. Also, students get to interpret the social aspects of the data and determine how they feel about the circumstances that these women find themselves in. |
| Open-Ended Instruction
: Lessons are structured so that multiple/complex answers are possible; students are not steered toward one 'right' answer. | ||
| Integrated Learning | Good | This resource has students representing data with graphs, tables and charts. The data used is real life and helps students understand the social and economical reality of women in Ethiopia and Mali. |
| Integrated Learning: Learning brings together content and skills from more than one subject area
| ||
| Inquiry Learning | Poor/Not considered | Although the activities are great, the directions to solve problems is prescribed. |
| Inquiry Learning: Learning is directed by questions, problems, or challenges that students work to address.
| ||
| Differentiated Instruction | Good | A variety of activity types are included. |
| Differentiated Instruction: Activities address a range of student learning styles, abilities and readiness.
| ||
| Experiential Learning | Satisfactory | In order to reach outcomes, students get to use real sources of information from Mali/Ethiopia. |
| Experiential Learning: Authentic learning experiences are provided
| ||
| Cooperative Learning | Satisfactory | Students get to work in group throughout the activities. |
| Cooperative Learning: Group and cooperative learning strategies are a priority.
| ||
| Assessment & Evaluation | Good | Although there is no explicit assessment tools in this resource, there is a multitude of activities that a teacher could use as formative or summative evaluation tools. For example, the summary activity for session 2 asks students to match cards that go together on different subjects. |
| Assessment & Evaluation: Tools are provided that help students and teachers to capture formative and summative information about students' learning and performance. These tools may include reflection questions, checklists, rubrics, etc. | ||
| Peer Teaching | Poor/Not considered | Not Considered |
| Peer Teaching: Provides opportunities for students to actively present their knowledge and skills to peers and/or act as teachers and mentors.
| ||
| Case Studies | Very Good | Students are using real life data that come from the Women's Collective Action research project. |
| Case Studies: Relevant case studies are included. Case studies are thorough descriptions of real events from real situations that students use to explore concepts in an authentic context. | ||
| Locus of Control | Poor/Not considered | Not considered. |
| Locus of Control: Meaningful opportunities are provided for students to choose elements of program content, the medium in which they wish to work, and/or to go deeper into a chosen issue. | ||